
Simpler to understand
Most orderflow vendors use a kitchen-sink approach and bombard you with metrics and plots –hoping you can work out what to do with them.
Because Optimal Orderflow was designed by traders, we know that in a live market you need to be able to act without hesitation, and that means having clear and relevant information.
So we’ve taken out the sensory-overload of traditional orderflow tools and replaced it with auto signal-processing using color-coding and bar markers, leveraging the information that really matters. Technology you can act upon –instantly.
Set up for you
Why spend time trying to create a chart that works? We’ve done the hard work for you and combined our unique tools into pre-configured chart templates (currently for YM, more to follow) that help give you an edge right out of the box.
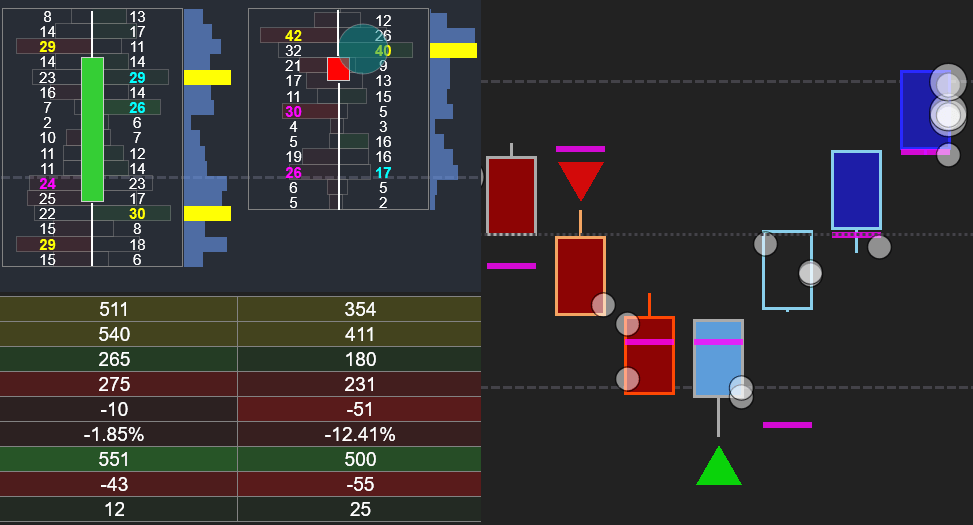
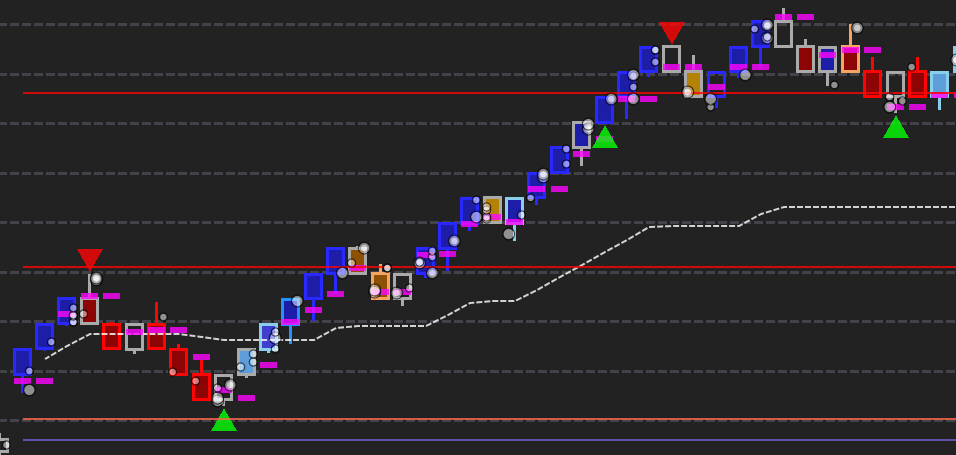
Research has shown that people cannot effectively process more than four streams of dynamic information at once. So our chart templates combine the most important signal data on a single chart: Imbalances, Volume Profile, Commitment of Traders and Point of Control. No other charts to follow, no indicator panels to track.
The best tools, the simplest presentation.
Trading guide
Optimal Orderflow allows you to see the game-behind-the-game by visualizing markets at transactional level –the foundation of market structure.
To help you on your way we include a 50 page Trading Guide covering:
- Hints and tips for using the indicators
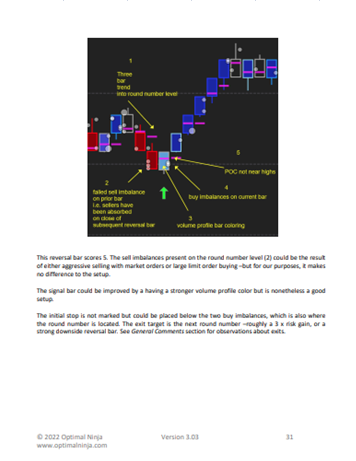
- How to grade entry setups
- Sample entry set-ups
- Performance tracking
- Trading psychology
With practice you’ll be able to gauge the sentiment underpinning price action by watching buying/selling aggression -light years ahead of those traders using lagging EMAs and discredited candlestick patterns, or those trying to decode footprint charts in fast-moving markets.
Draw a line under the past. Start a superior way of trading today.