
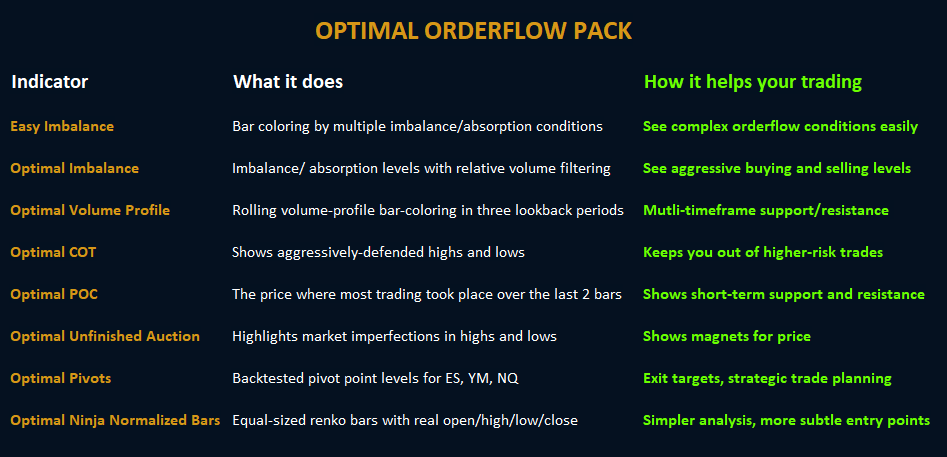
Our Optimal Orderflow pack includes all the following Optimal Orderflow products and chart templates for a complete intraday system:
Optimal Orderflow Easy Imbalance
We’re really excited to finally release this ground-breaking, super-class indicator!
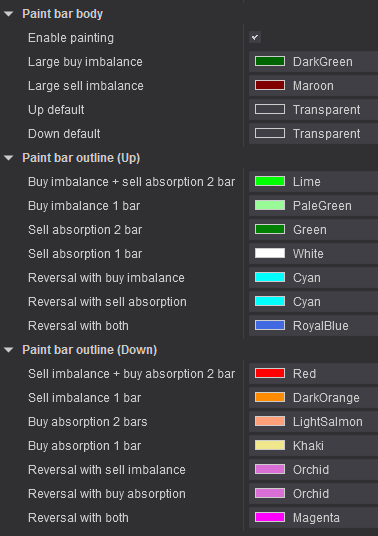
Using the signals from Optimal Imbalance (see below), Easy Imbalance scans every live bar for 16 pre-configured orderflow conditions in real time and colors your price bars by signal strength –as they happen.
It’s now simple to spot trend and reversal orderflow set-ups without needing to analyse imbalance levels at all. Simply watch the bar colors change and start positioning for your entry -streets ahead of other traders trying to manually fathom footprint bars, bid-ask numbers and bar deltas.
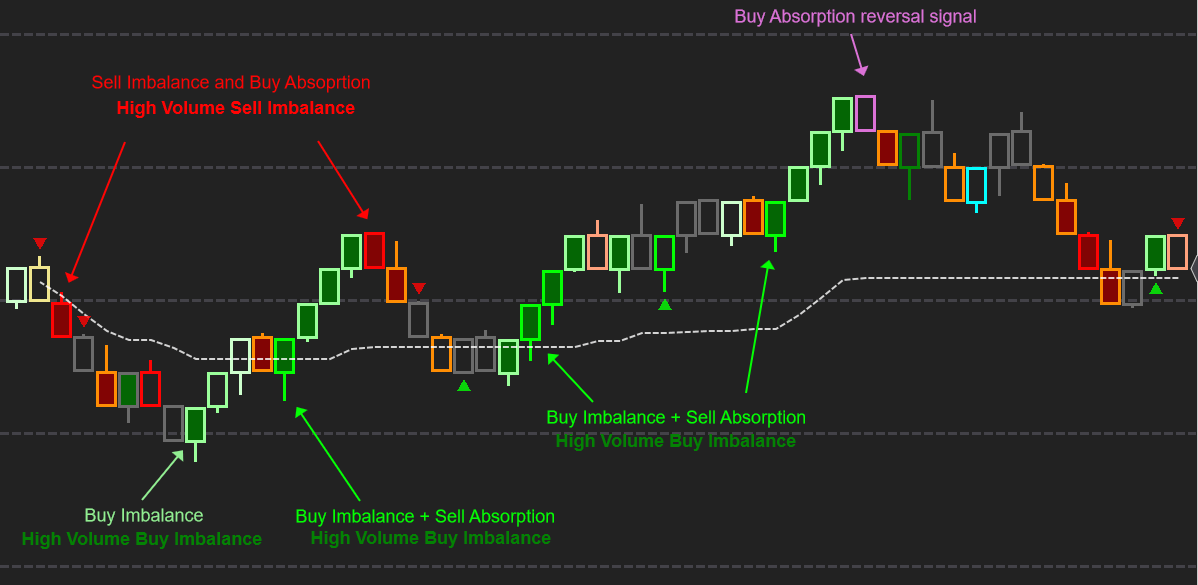
This is much more than single bar analysis. Designed for use with Optimal Ninja Normalized Bars (see below), our unique algorithm processes all the statistically-significant imbalances and absorption levels across the last two bars to show you instantly:
- Areas with the largest buy/sell imbalances, favouring continued directional moves
- Areas with both strong imbalance and strong absorption –the most powerful signals
- Aggressive and weak trend participation
- Strong and risky reversal patterns
- Bars with extra-high imbalance volumes for breakouts and end-of trend climaxes
Whether you’re scalping or holding for larger moves, Easy Imbalance gives an instant X-ray into the underlying pressure at any moment on the chart. If you’re new to orderflow trading, or if you’ve struggled in the past to get the results you deserve, you’ll find Easy Imbalance super-powerful but a breeze to use.
Optimal Orderflow Imbalance
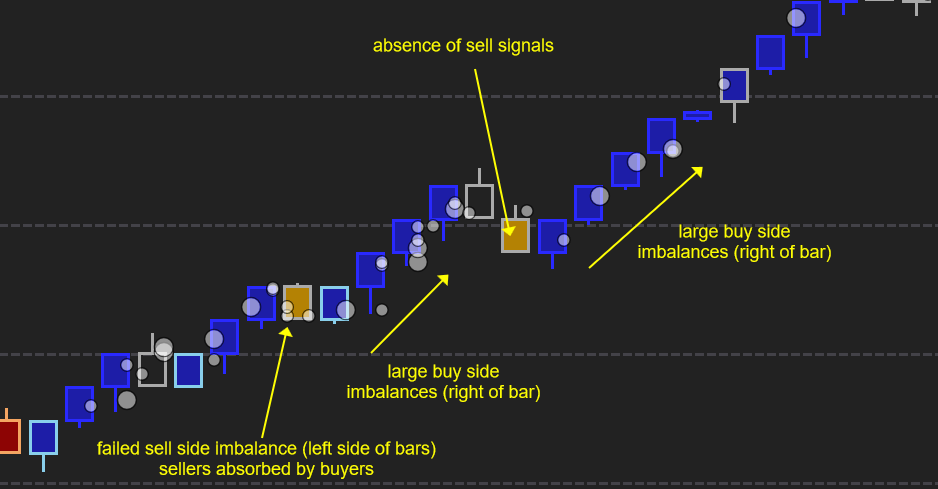
Optimal Orderflow Imbalance is the underlying signal processing on which Easy Imbalance (see above) is based, and displays the individual price imbalance plots for further discretionary analysis, if desired.
Imbalances represent buying/selling aggression. Knowing when that aggressive action succeeded in pushing prices and when it failed to push prices is a hugely powerful insight into understanding market dynamics and building a trading strategy.
This is where Optimal Orderflow Imbalance excels. Other imbalance tools simply plot every imbalance level above a certain size threshold, swamping your bars with plots that you can’t understand in real time. We use a proprietary filtering system to display only statistically-significant imbalances based on recent imbalance levels and on volume analysis.
We also split larger and smaller imbalances into two plot sizes so you can see instantly where the most sizeable imbalances occur –without overwhelming your bars.
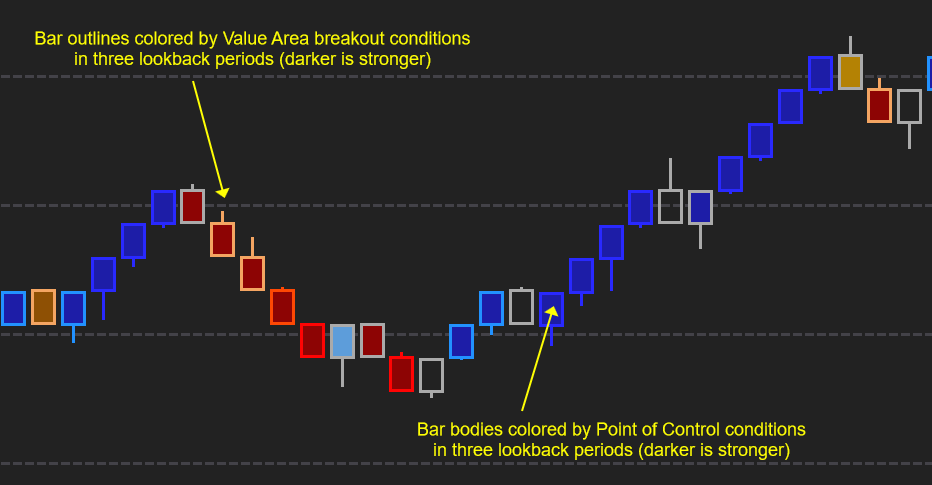
Optimal Orderflow Volume Profile
Optimal Orderflow Volume Profile is a next-generation volume profile tool that computes rolling-period Volume Profile levels in three different timescales simultaneously.
It color-codes the body and outline of your price bars according to the position of the Point of Control and Value Area across three lookback periods, making it easy to see the strongest and weakest profile conditions on each bar, without any other plots on the chart!
This gives an instant multi-dimensional view of any single bar on the chart using bar coloring.
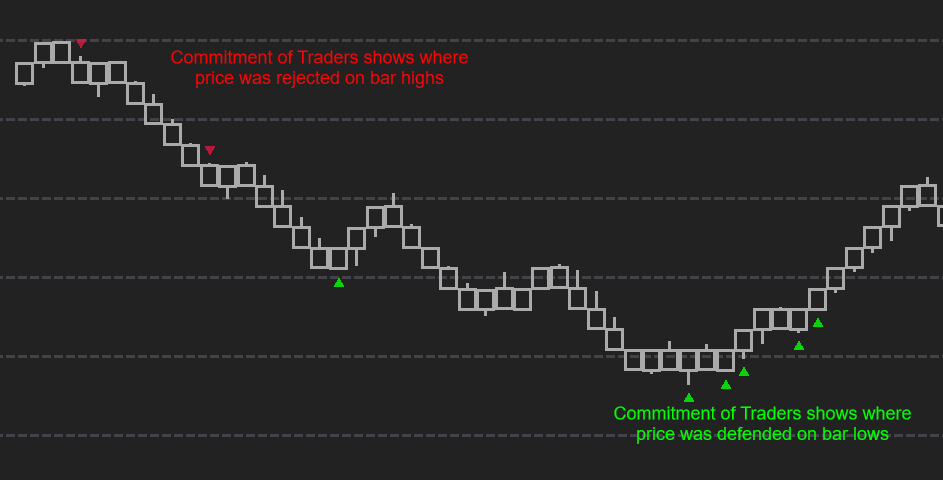
Optimal Orderflow Commitment of Traders
Want to know where price was heavily defended? Optimal Orderflow Commitment of Traders (not to be confused with the weekly CTFC report) examines imbalances at new or repeated highs/lows to give a heads-up of short term aggressive turning points or directional bias.
We show these levels on your chart with easy-to-spot green and red triangles.
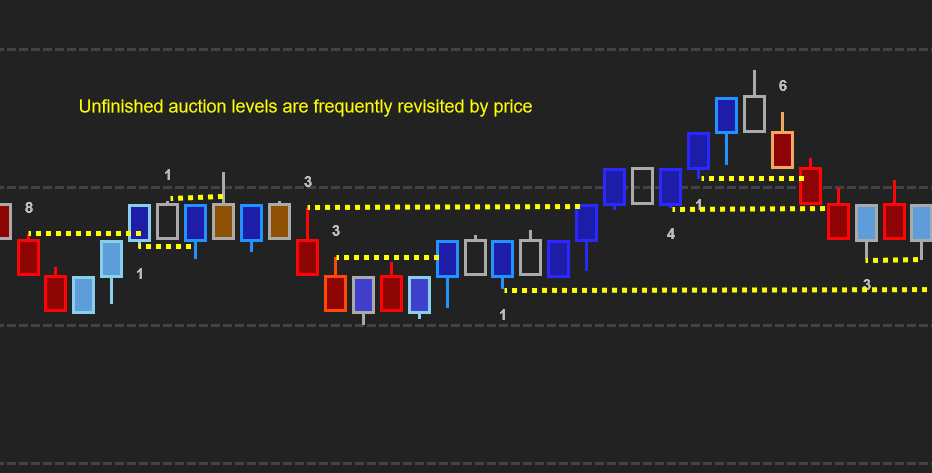
Optimal Orderflow Unfinished Auction
Unfinished auctions are short-term anomalies on the highs or lows of price bars –areas where the market did not complete its auction process and may therefore attract price to complete the process in future.
Optimal Orderflow Unfinished Auction
tells you where those levels were with a single number showing the significance of those levels. Larger numbers = greater magnets for price.
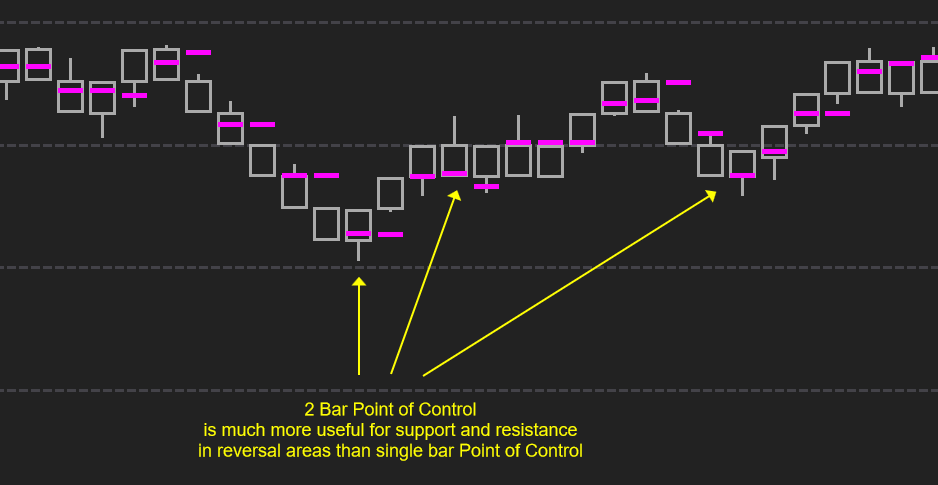
Optimal Orderflow Point of Control
See the price level with the most traded volume over the last two bars.
Standard Point of Control indicators show you the POC of each individual bar, but this doesn’t give much insight into potential swing highs/lows, where the overall level across a trend bar and reversal bar is much more important.
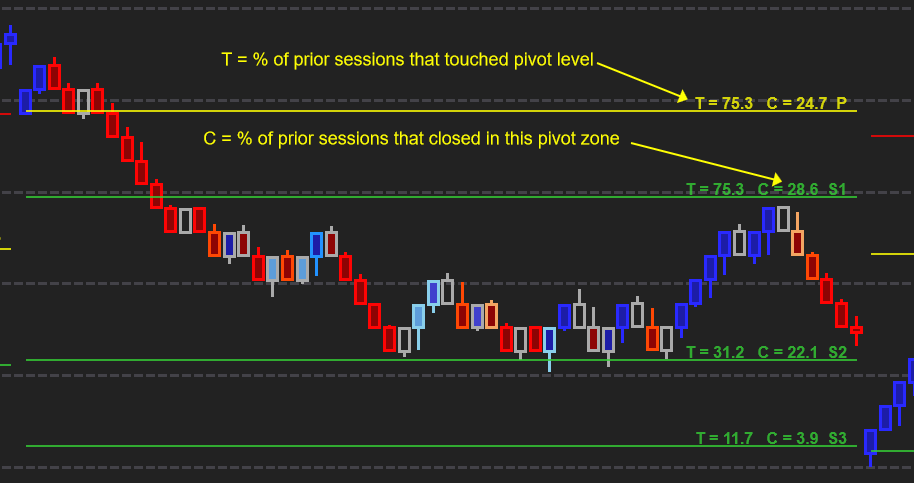
Optimal Orderflow Pivots
Bring the power of historical probabilities to your trading!
We backtested floor trader pivots for 2011-2021 to bring you actionable insights you can use to structure your trading plan every day with specific price levels.
For more information see our videos on Optimal Pivots.
Optimal Ninja Normalized Bars
Optimal Ninja Normalized Bars divide price movement into equal-sized blocks. This affords three clear advantages over traders using time-bars:
- Earlier entry in trends -much faster than other traders waiting for time bars to close
- More subtle entry signals than time bars, which are obvious to most traders
- Only two possible closing prices make trade decisions much simpler
Compare these two charts of the first 15 minutes of a session:
Normalized bars (left), 5 minute bars (right)
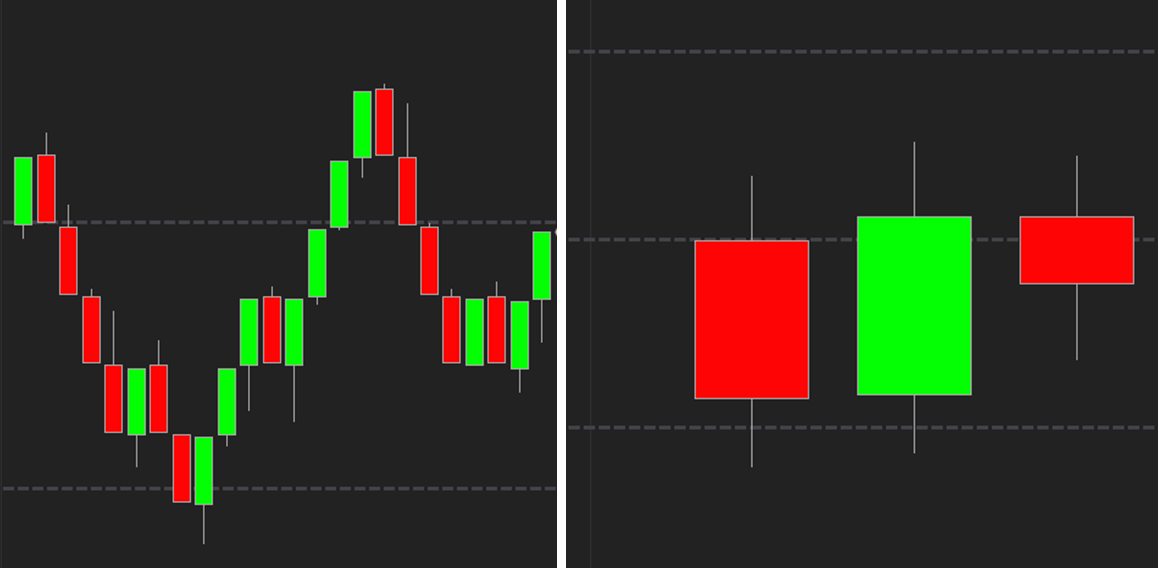
The 5 minute candlestick charts subsume underlying price action, yielding no obvious entry points. The greater resolution of normalized bars presents more opportunity.
Unique features
- Real open/high/low/close ensures compatibility with orderflow tools
- 1-tick breakout requirement reduces trading range overlaps
- Displays actual gapping between close and open of new bar