
Finding entry points with Optimal Orderflow can be as simple as 1-2-3:
1. Wait for colored bars (significant imbalance/absorption)
2. Don’t trade against COT signals (red and green triangles)
3. Don’t trade into POC levels (magenta hashes)
Of course, you’ll also want to follow price action and key levels such as the prior session’s H/L/C and round numbers, but keeping to these three simple guidelines will help you stay on the right side of the market.
Unlike many vendors, we don’t need to cherry-pick sessions to show our products in action. Optimal Orderflow provides you with actionable signals every day, based upon what is happening at transactional level, not lagging data from ten minutes ago.
So here is a complete week for YM 03-22. We're using Optimal Ninja Normalized Bars with a bar body size of 25 ticks and real open / high / low / close.
See our YouTube channel click
here
Monday 10th January 2022 -Trading Range and Round Number Breakout

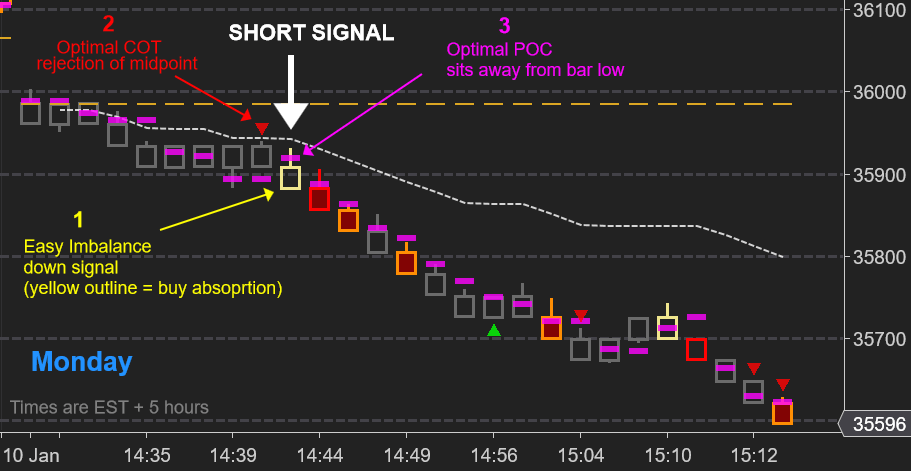
Today opened with a gap down and the market traded consistently below the midpoint for the first ten minutes with neutral (gray) bars. The first Optimal Orderflow signal was an Optimal COT rejection (2) off a pullback to the midpoint –a heads-up to position for short entries.
On the following bar we had a breakout of the prior five bar range and 35900, with an Easy Orderflow yellow bar (1) indicating absorption of buyers. The magenta POC (3) was situated away from the close of this bar. This is therefore a short entry signal.
Exit target would be 35,800 = approximately 75 ticks.
Note the absence of long entry signals anywhere on the chart –keeping you out of costly countertrend trading.
Tuesday 11th January 2022 -Trading Range and Round Number Breakout
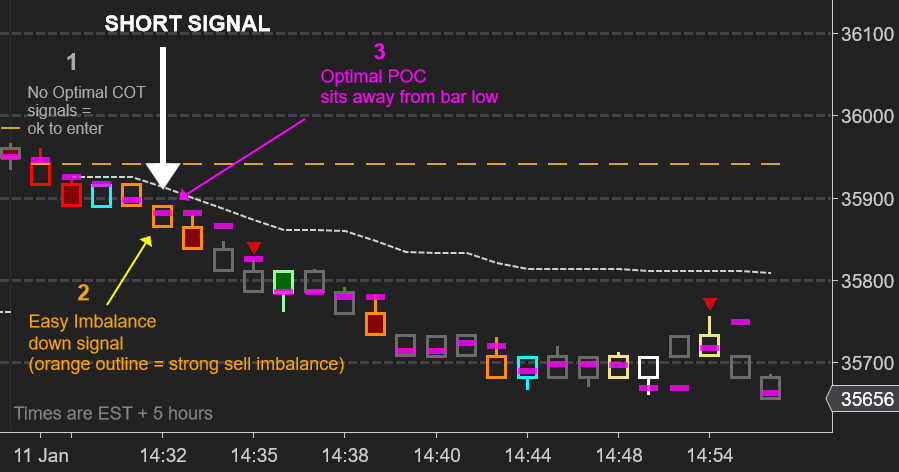
Early in the session we had a failed attempt to reverse off 35,900 (cyan bar) which was stopped by the magenta POC resistance level on bar three.
This was followed by a downside breakout of the prior three-bar range. This breakout bar was colored orange by Easy Imbalance (2) which indicates strong sell imbalances. With the magenta POC level (3) away from the close of the bar, this was a short signal entry.
The subsequent strong down bar was also a possible short entry since there was a pullback failure to the POC.
Exit target would be 35,800 = approximately 60 ticks.
Note that the green reversal at 35,800 was not an entry signal since it closed very close to an
Optimal COT down signal on the prior bar –keeping you out of a costly countertrend entry.
Wednesday 12th January 2022 - Reversal off Defended Swing Lows
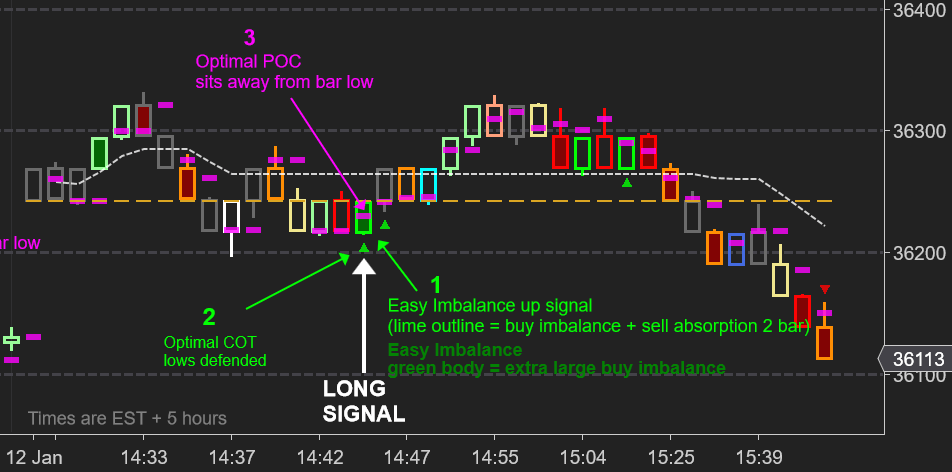
There were some early tradeable scalps here but the best opportunity was about 15 minutes into the session as the market retested earlier swing lows.
The signal bar had a lime green outline (buy imbalance + sell absorption across two bars –the strongest signal) and also extra-large buy imbalance, shown by the green bar body (1). Additionally, there was an Optimal COT signal (2) showing defended price lows, and POC (3) is located away from the close. This was a strong long setup.
Exit target would be 36,300 or the prior swing high off the open = 50/75 ticks.
Note that we had an orange reversal bar two bars into the trade, but this closed into a magenta
Optimal POC area and the open of the session (dotted gold line). Given the strength of the green setup bar, this reversal is likely to fail, so it made sense to hold the open long. However, if you did close at break-even, there was another opportunity on the following magenta bar.
Thursday 13th January 2022 - Reversal off
Failed Breakout
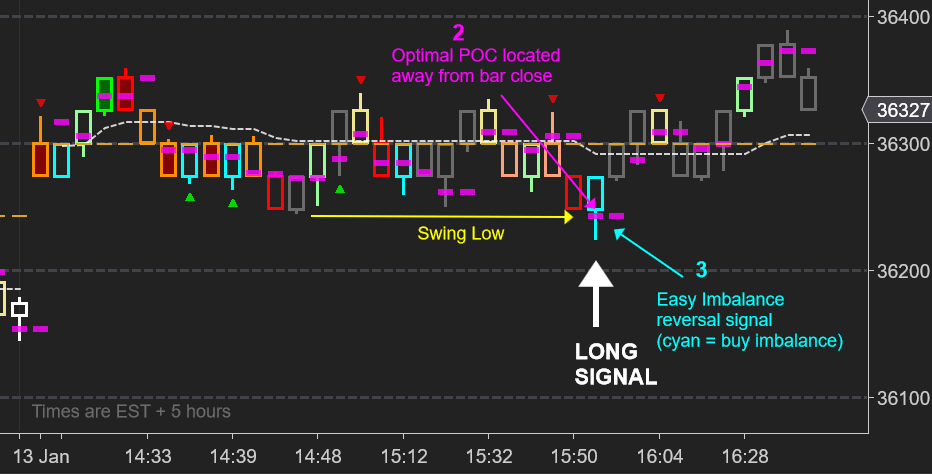
This was a more challenging session as the market remained in a tight range for the first two hours, oscillating around 36300. There was a good short setup on bar five of the session (red bar) following the climactic green bar but the market was moving quickly here and this was not a practical short entry.
Subsequently we had indications of the lows being aggressively defended with the two cyan reversal bars and Optimal COT up signals, but these were not entries as they closed on the nearby COT down signal (red arrow) off 36300 on bar seven.
Later reversal bars presented scalp opportunities only as they all closed on the midpoint and 36300 and the session open. The best trade (3) was the later cyan bar. Easy Imbalance gave a two bar reversal signal with buy imbalance, and Optimal POC was low in the bar (2). It was also a failed breakout of the prior swing low.
The exit target for this trade was the prior COT rejection down signal, about 50 ticks.
Friday 14th January 2022 - Reversal off Midpoint & Defended Swing Lows
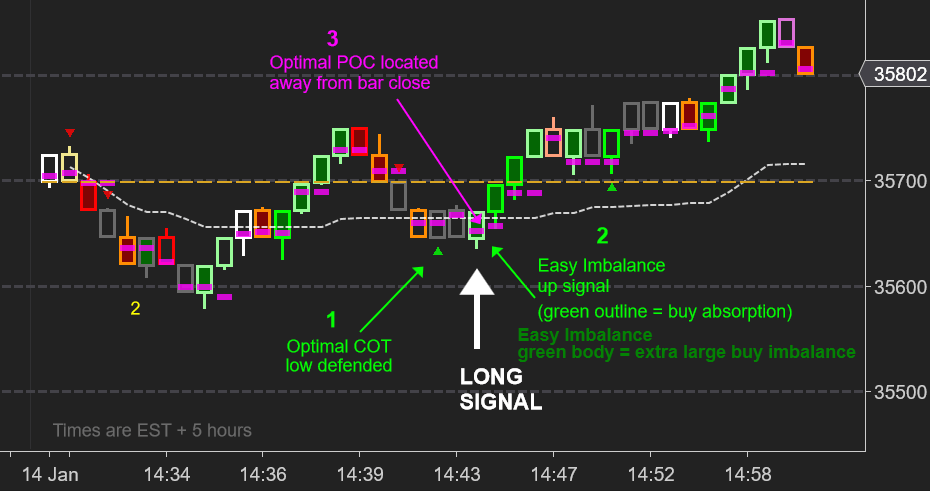
There were a number of excellent opportunities early in this session. The trade we will focus on was a pullback to the session midpoint with defended swing lows.
When price pulled back to midpoint about fifteen minutes into the session, Optimal COT posted a green up triangle (1) indicating the lows of that bar had been aggressively defended by buyers.
Two bars later, Easy Imbalance showed a pale green outline (indicating buy imbalance) and a green body (an unusually large buy imbalance) and a false breakout below the lows of that trading range (2).
Optimal POC was situated low in the signal bar indicating support for a long trade.
The subsequent up bars were very strong bull bars and one could have held up to the prior swing high for a 75 tick gain.