
Optimal Levels
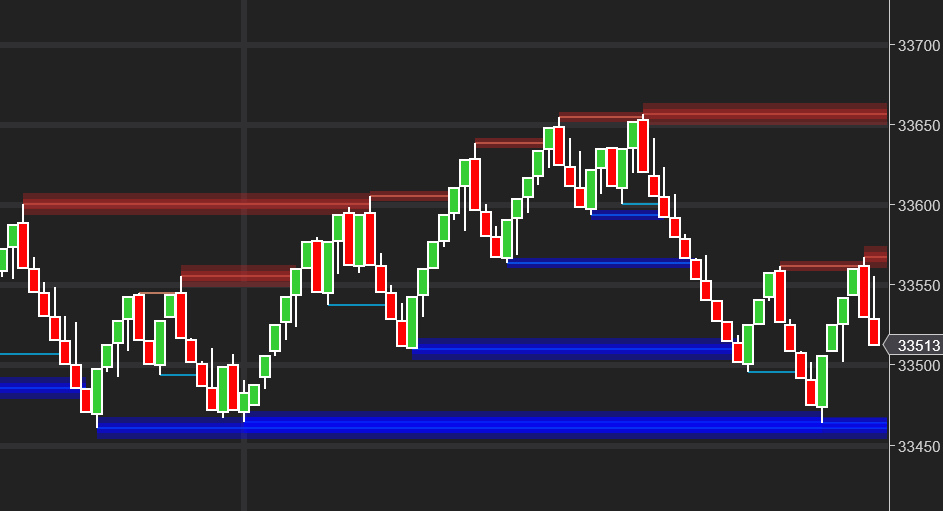
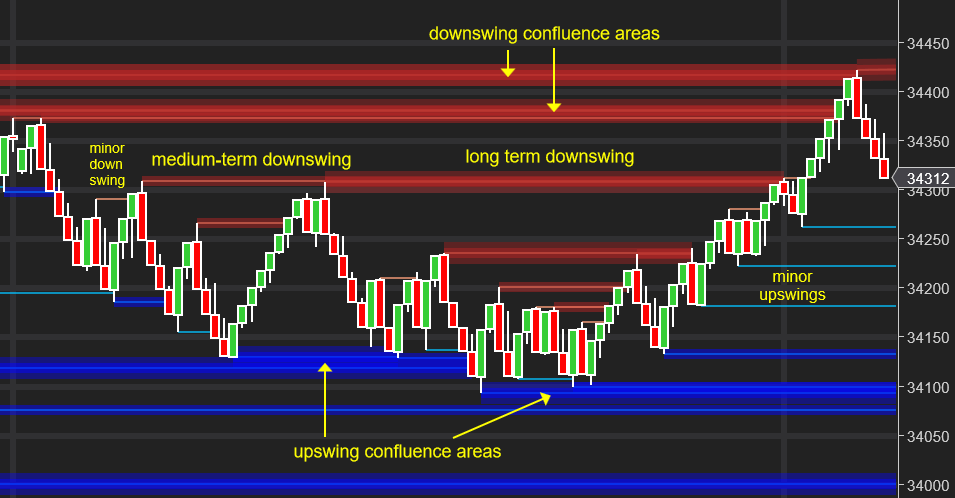
With Optimal Levels, it’s simple to identify exit targets for open trades and confluence support/resistance for swing/scalp fade entries.
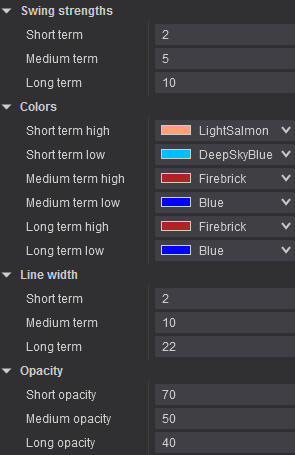
You can choose three swing strengths and fully customize the presentation on your chart:
We believe that straightforward price action analysis beats esoteric sine-wave patterns and lagging oscillators in identifying the most important levels, and is an essential element of intra-day charting.
Used in conjunction with Optimal Renko Bars, Optimal Vision and Optimal Delta, it forms a simple, unique blueprint for your trading –all shown on the price panel. See Chart Templates page for more information (coming soon).
We believe that straightforward price action analysis beats esoteric sine-wave patterns and lagging oscillators in identifying the most important levels, and is an essential element of intra-day charting.
Used in conjunction with Optimal Renko Bars, Optimal Vision and Optimal Delta, it forms a simple, unique blueprint for your trading –all shown on the price panel. See Chart Templates page for more information.