
Optimal Pivots plots classic floor trader pivots onto your chart –but with a twist!
Each pivot level and yesterday’s High/Low/Close comes with two market statistics appended: the Touch Rate and the Close Rate.
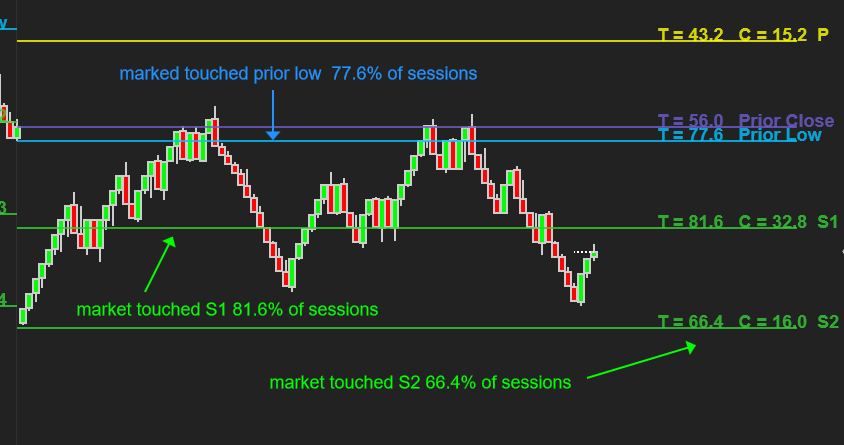
Touch rate (T) = the percentage of prior sessions that touched each level
Close rate (C) = the percentage of prior sessions that closed within each pivot zone
Derived from opening gap analysis of the US equities session over the last 10 years, these metrics bring the power of historical probability to today’s chart in a way that’s super easy to understand.
Knowing where the market has tended to move to in similar situations is a hugely insightful piece of information which makes building an objective, empirical framework for every trading session straightforward.
Specifically, Optimal Pivots can help you
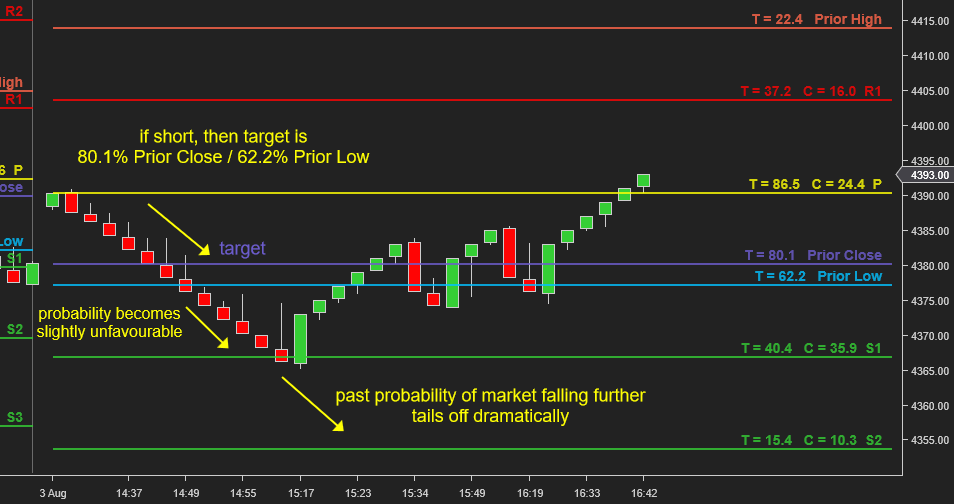
- Hold profitable trades to historically high probability touch levels
- Fade moves from low probability areas
- Avoid fading moves before high probability levels have been touched
- Identify areas where the session most frequently closed
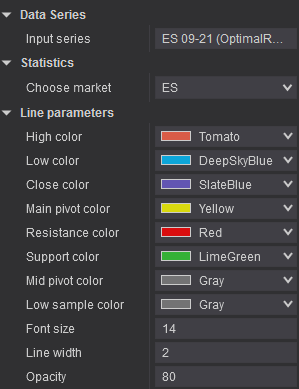
Optimal Pivots is available for ES, NQ and YM. Simply select your desired market from the dropdown box:
Strategy Compatible
All the outputs in Optimal Pivots are callable in strategy builder or NinjaScript:
- Pivot levels and prior H/L/C levels
- Touch rate % of pivot levels
- Touch rate % of prior H/L/C
- Pivot with highest % touch rate in each session
- Prior H/L/C with highest % touch rate in each session
Using these outputs it is relatively simple to build and test pivot point based strategies without complex coding.
Embrace 10 years of market statistics -plotted direct on your chart.