
Smart Support/Resistance
Smart Support/Resistance
Optimal Ninja Snap ES Bars make it simple to spot support and resistance areas in the form of overlapping bars but sometimes there are more subtle price rejection levels on the chart.
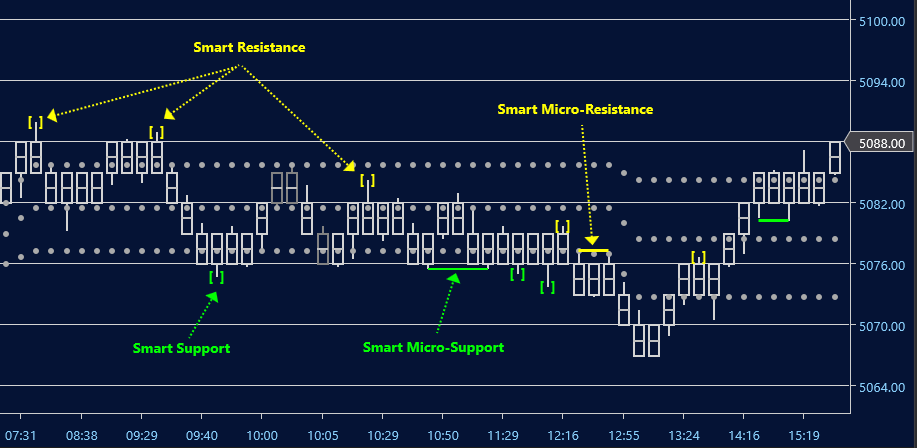
Smart Support and Resistance searches for medium term and short ('micro') term price-rejections and marks these on the chart in green and yellow.
With micro signals, these are usually double-top and double-bottom patterns formed over the last 2-4 bars, but the logic also detects hidden trend-line breaks or micro-two legged patterns that can strengthen reversal signals.
Medium-term patterns are [ ] and [ ] and micro levels are shown by connecting lines.
These are not normally entry-signals in themselves but are intended to aid chart-reading in conjunction with Quartz and Smart Algo Detector.
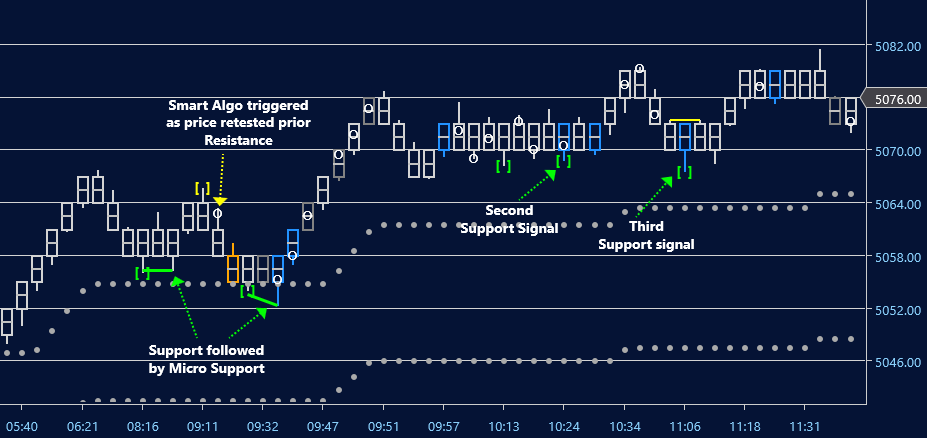
The following session shows a chart with all indicators loaded. Notice how the confluence of Support signals ultimately resulted in sizeable moves.
The downward-sloping green line at around 0932 EST is a hidden trend-line break pattern, or micro bullish support signal.
For more information please see our FAQ.