Optimal Vision
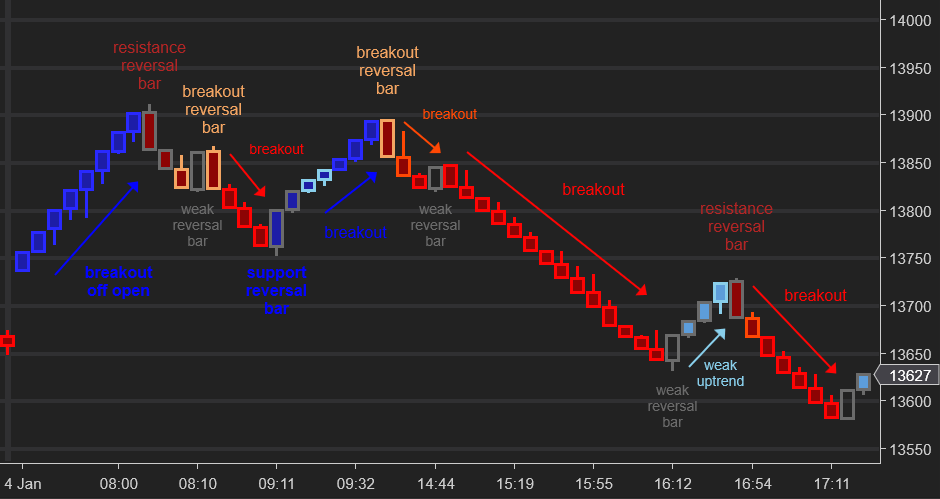
Bar outlines are painted according to breakout conditions, bar bodies are painted according to support/resistance conditions. Stronger colors = stronger signals.
No cluttered charts. No complex analysis. If you see colors you can trade with Optimal Vision!
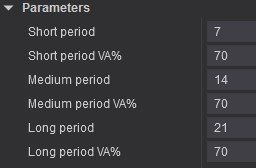
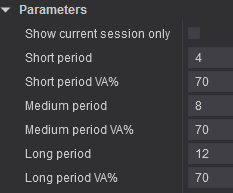
Crucially, we use rolling lookback periods in our logic, not whole sessions. This means that you get a heads-up about local Point of Control and Value Areas, without the distortionary impact of the open of the session and past news events, etc. And Optimal Vision calculates automatically, no need to access cumbersome click and highlight tools in fast-moving markets.
See volume profile information that is relevant now, not two hours ago! Get long, medium and short term signals, painted on your bars –all in real time.
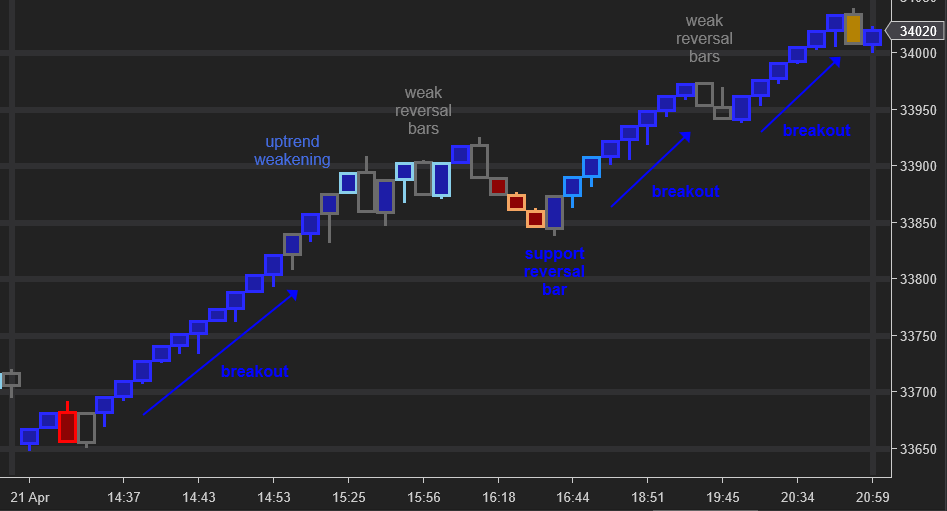
Bar outlines are painted according to breakout conditions, bar bodies are painted according to support/resistance conditions. Stronger colors = stronger signals.
No cluttered charts. No complex analysis. If you see colors you can trade with Optimal Vision!
Crucially, we use rolling lookback periods in our logic, not whole sessions. This means that you get a heads-up about local Point of Control and Value Areas, without the distortionary impact of the open of the session and past news events, etc. And Optimal Vision calculates automatically, no need to access cumbersome click and highlight tools in fast-moving markets.
See volume profile information that is relevant now, not two hours ago! Get long, medium and short term signals, painted on your bars –all in real time.