
Optimal Delta
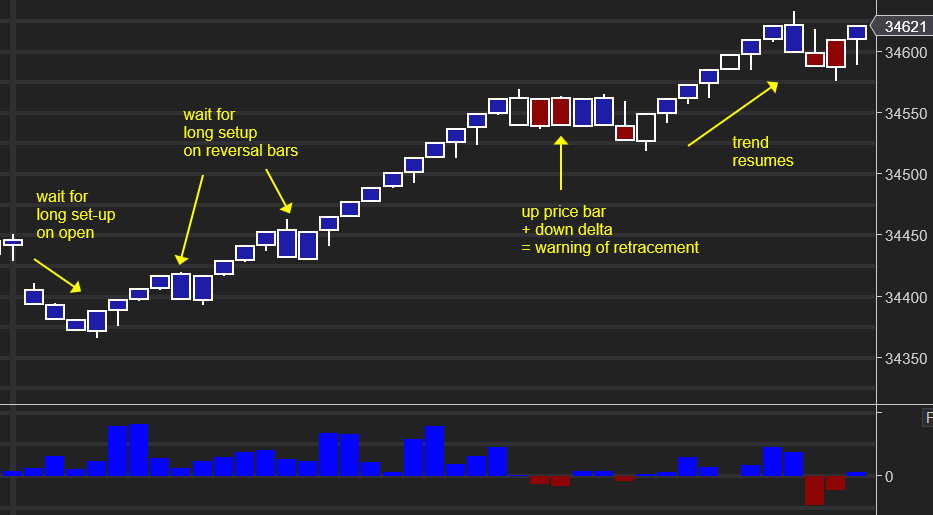
Optimal Delta measures buying and selling aggression. Trades are categorized as a buy if they take place at the ask or above, and as a sell at the bid or below. The “delta” is the difference between the volume of these buy and sell trades.
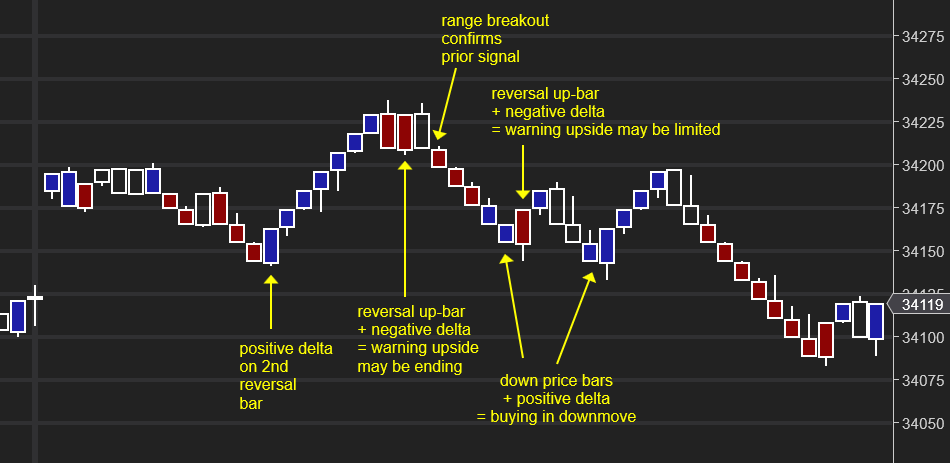
Buy-sell delta indicators usually calculate on a per-bar basis, which typically matches the direction of the bar in renko charts. Optimal Delta computes delta across the range of the last two bars, which is more useful for assessing the strength of reversal bars. Two-bar analysis can keep you out of fading moves that are more likely to have second legs, and can give a heads-up to seek with-trend entries.
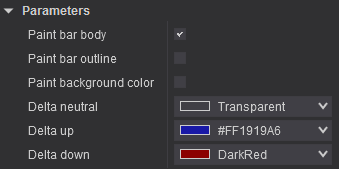
You have the option to color the background, the body of the bar or the outline of the bar.
Of course, a buy-sell delta can never reveal the entire picture, since limit orders may dominate, but used in conjunction with profile tools like Optimal Vision, you can easily see where price sits in relation to Value Area Highs/Lows and Point of Control, and how much short term aggression at the market there is behind that move.
Optimal Delta
You have the option to color the background, the body of the bar or the outline of the bar.
Of course, a buy-sell delta can never reveal the entire picture, since limit orders may dominate, but used in conjunction with profile tools like Optimal Vision, you can easily see where price sits in relation to Value Area Highs/Lows and Point of Control, and how much short term aggression at the market there is behind that move.