
Optimal Value Area
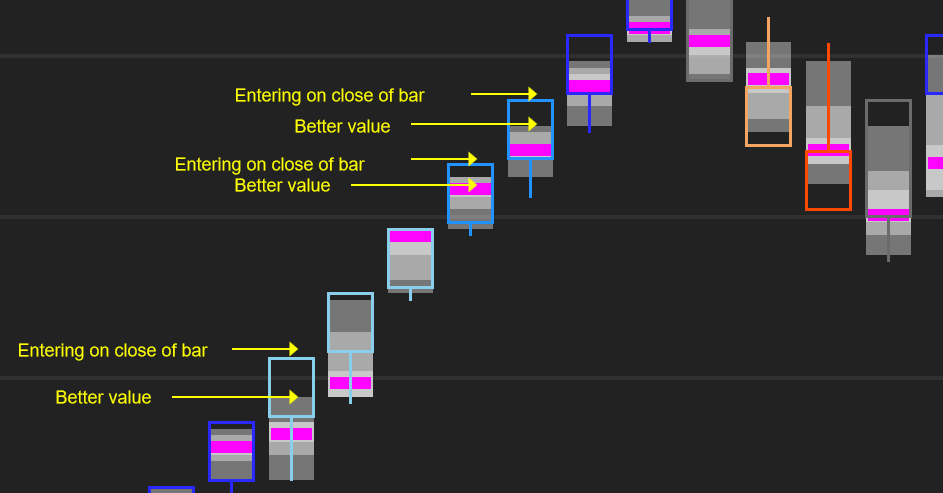
Habitually entering on the close of a bar rather than waiting for a pullback into one of these Value Areas means you are consistently overpaying to get into a trade. Over time, these overpayments add up.
Optimal Value Area encourages you to consider not only whether to enter, but where to enter.
Value Areas gaps can also reveal areas of low liquidity that frequently as magnets for price in the near future. Large gaps between 70% bar value areas are often traded back through until contiguous 70% Value Areas form.
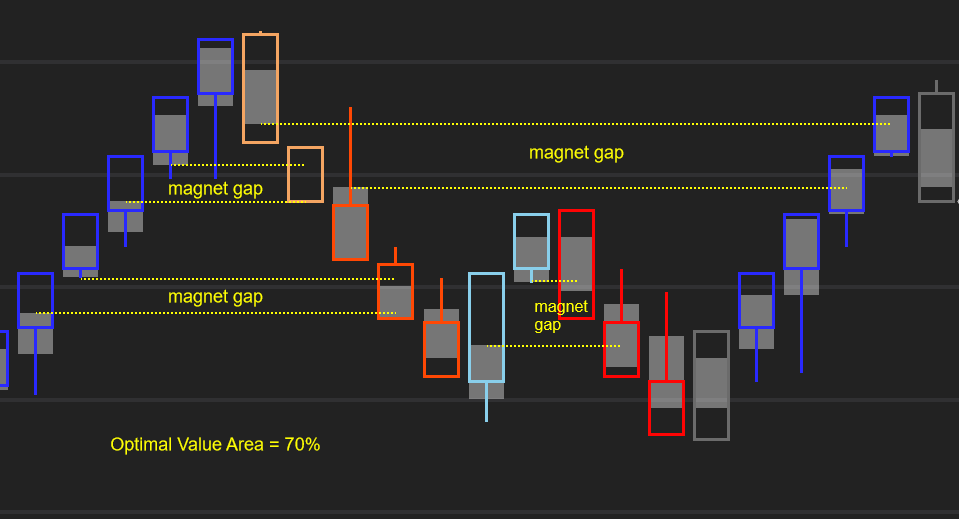
Optimal Value Area thus provides two key pieces of data: very short term tactical information for better value on trade entries, and longer-term strategic information for zones where the market may return to fill. Strategic information can help reveal unfolding market structure and inform exit targets.
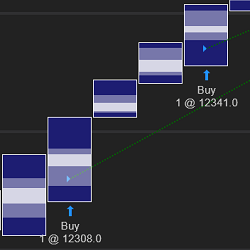
Optimal Value Area is also strategy builder compatible, so that you can place orders to enter or exit at a Value Area High / Low or Point of Control.
Don’t overpay on entries.
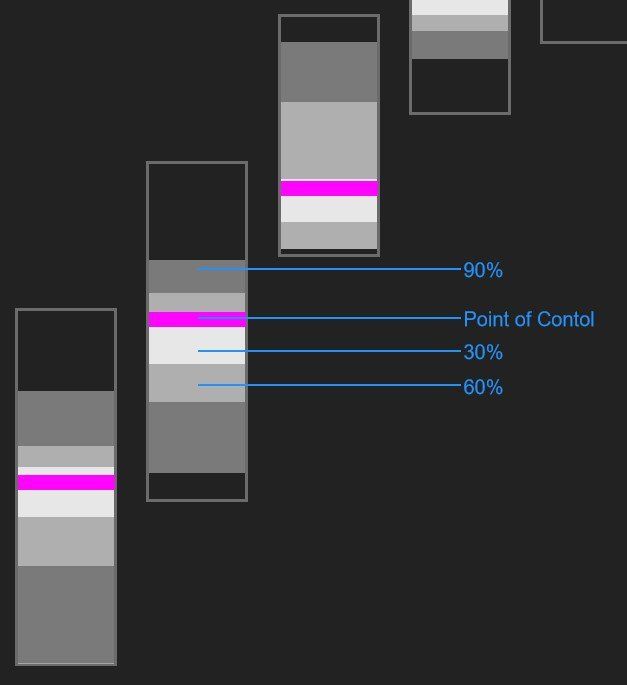
Optimal Value Area shades areas of a bar according to the volume levels that took place within it.
The Volume Point of Control (POC) shows the price at which the most volume was transacted.
The three Value Areas zones show the areas where 90%, 60% and 30% of the bar’s volume was transacted.
Habitually entering on the close of a bar rather than waiting for a pullback into one of these value areas means you are consistently overpaying to get into a trade. Over time, these overpayments add up.
Optimal Value Area encourages you to consider not only whether to enter, but where to enter.
Value Areas gaps can also reveal areas of low liquidity that frequently as magnets for price in the near future. Large gaps between 70% bar value areas are often traded back through until contiguous 70% Value Areas form.
Optimal Value Area thus provides two key pieces of data: very short term tactical information for better value on trade entries, and longer-term strategic information for zones where the market may return to fill. Strategic information can help reveal unfolding market structure and inform exit targets.
Optimal Value Area is also strategy builder compatible, so that you place orders to enter at a Value Area High or Low or Point of Control.