
Every bar on a chart tells a story. But with standard orderflow tools, it can be difficult to read in real time.
Optimal Orderflow chart templates make it simple to see real-time bar strength by combining multiple orderflow conditions with clear color-coding.
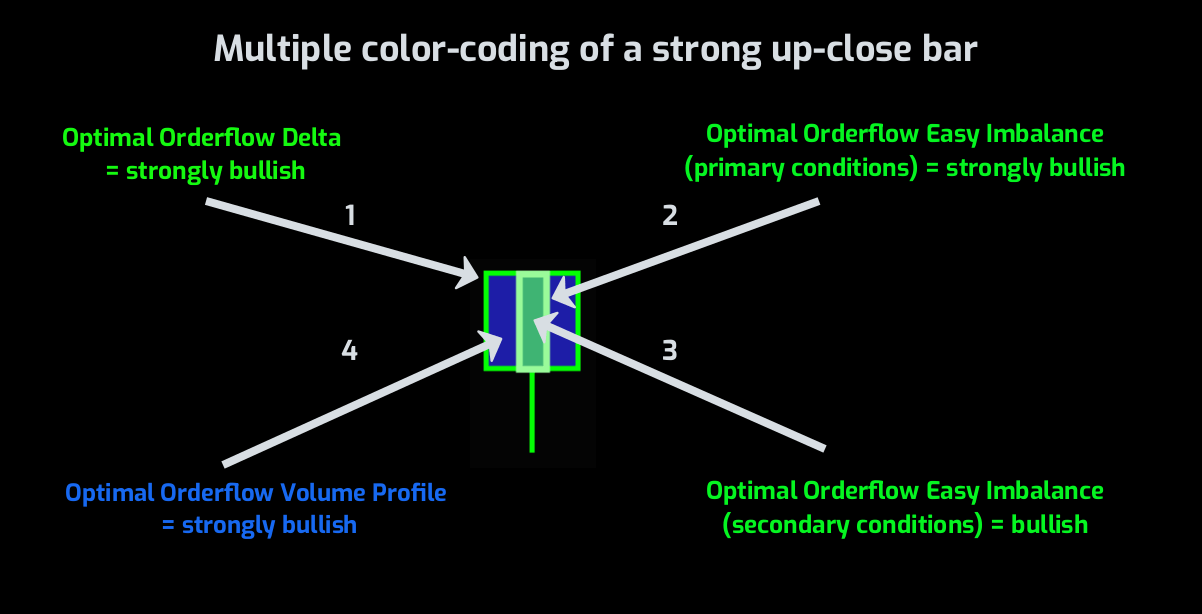
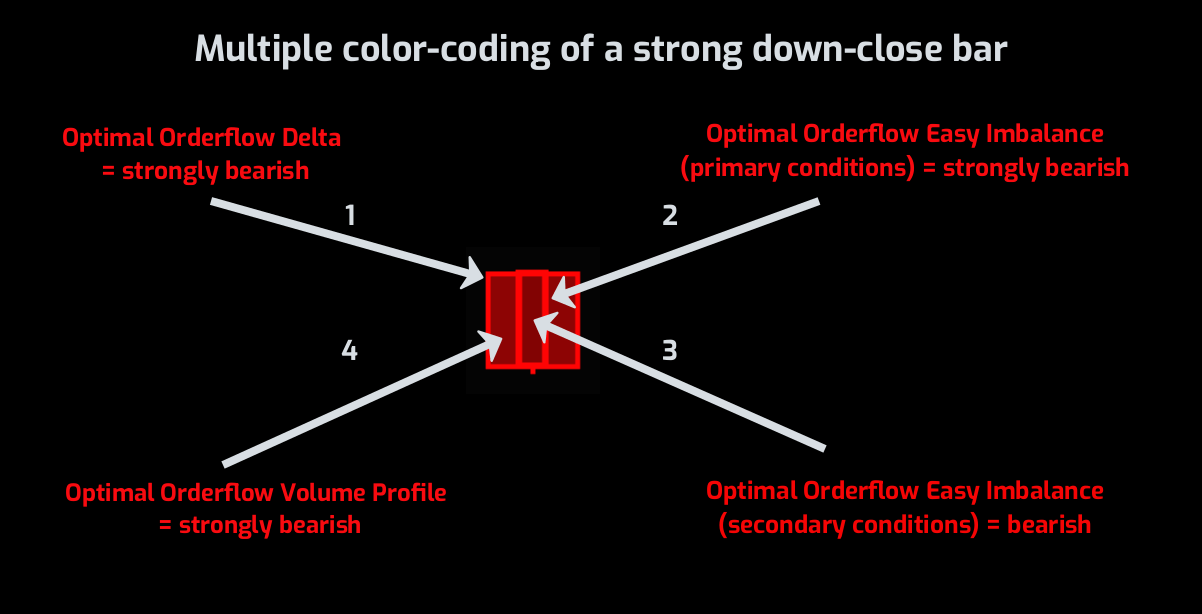
Our unique templates paint every bar on your chart with four baseline metrics:
* Optimal Orderflow Easy Imbalance (14 primary imbalance conditions)
* Optimal Orderflow Easy Imbalance (2 secondary imbalance conditions)
* Optimal Orderflow Volume Profile (multi-period Point of Control conditions)
* Optimal Orderflow Delta (4 buy-sell delta conditions)
This blended approach makes trading with orderflow charts much more intuitive, and it updates on every tick, so that you can see the colors changing on an open bar in real time.
Shades of green and blue are bullish, shades of red and orange are bearish.
Across multiple bars shifts in sentiment become readily apparent:
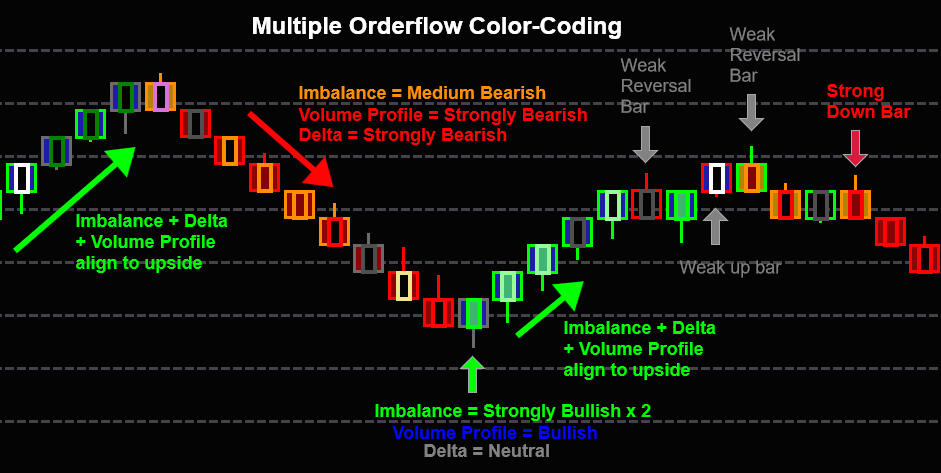
Out chart templates allow you to focus on planning entries ahead of time whilst complex orderflow analysis is done for you.
Optimal Orderflow comes with pre-configured chart templates for the following markets:
Dow Jones (YM/MYM)
Russell 2000 (RTY/M2K)
DAX (FDAX/FDXM/FESX)
Australian Dollar (6A)
British Pound (6B)
Euro (6E)
Japanese Yen (6J)
Crude Oil (CL)
Gold (GC)
ES/MES and NQ/MNQ are not currently supported